- Taras Rodynenko


Gatsby is one of most known SSG frameworks nowadays, and you can find a lot of guides how to configure your project for your needs. Gatsby team and community spend time to make Gatsby builds performant and optimal. But sometimes your own configurations can shoot yourself in your foot, and you need to find where is the bottleneck and why builds are so long. In this article we are going to setup solution that can help you to look inside your builds. We are going to talk about tracing.
What is Tracing?
Tracing is the process that provides developers with information useful for debugging. It sounds very closer to logging, isn't it? Yeah, it is, and there is no clear difference between tracing and logging, everything is in details. Here when we are talking about Gatsby tracing, we mean getting information about internal Gatsby processes and their parts that happens during the build.
Some of information we already get from build logs, like
Page build state was successful: 8.6s
Logs help us to understand progress and timing information. Unfortunately, there is no clear way to see and compare those values in dynamic, or look deeper (closer to child processes). When it comes to performance investigation, it is good to have opportunity to separate more detailed data from common log flow. And we have a tool - turn on performance tracing for Gatsby builds
Collecting traces
We can find out from Gatsby documentation that there are several tracing formats that are used to share information:
- OpenTracing. Deprecated, but Gatsby is using it internally
- OpenTelemetry. Merger of the OpenTracing and OpenCensus projects. There is a shim from OpenTracing to OpenTelemetry.
We will use OpenTelemetry in our example, but first lets provide some useful definitions for building blocks from OpenTeletry documentations:
- Span represents a unit of work or operation (like method or plugin call). Spans are the building blocks of Traces.
- Traces, or Distributed Traces, records the paths taken by requests as they propagate through multi-service architectures, like microservice and serverless applications.
In our case we collect trace (called
build, because we will callgatsby buildcommand) and its spans that are generated by Gatsby.
Test project
In order to make some test runs, we need Gatsby project with configuration for tracing. For simplicity, lets use default gatsby-starter-blog as a start (you can find installed default project in ./gatsby-starter-blog-example):
npx gatsby new gatsby-starter-blog https://github.com/gatsbyjs/gatsby-starter-blog
Trace collector
Trace collector is the service that can receive, process, and export telemetry data. For our example we also need some collector service to receive traces and visualize them.
There are lot of open source solutions (like Jeager, Zipkin, OTLP, AWS Distro) and commercial ones (like Dynatrace).
For simplicity we are going to use Jaeger for our local needs. To start the service locally we can copy docker command from Gatsby docs, just update version of docker image :
docker run -d --name jaeger \
    -e COLLECTOR_ZIPKIN_HTTP_PORT=9411 \
    -p 5775:5775/udp \
    -p 6831:6831/udp \
    -p 6832:6832/udp \
    -p 5778:5778 \
    -p 16686:16686 \
    -p 14268:14268 \
    -p 9411:9411 \
    jaegertracing/all-in-one:latest
and now Jaeger should be available on http://localhost:16686
Tracing configuration
Get back for collecting tracing. We will configurate build traces in file tracing.js. Gatsby APIs require us to provide two mandatory methods create and stop to be exported.
exports.create = () => {
  // return tracer which Gatsby will use to create spans
}
exports.stop = async () => {
  // stopping collecting traces
}
Next step is to setup OpenTelementry environment.
First, add dependencies for opentelemetry and Jaeger's exporter:
yarn add @opentelemetry/exporter-jaeger @opentelemetry/resources @opentelemetry/sdk-trace-node @opentelemetry/semantic-conventions @opentelemetry/shim-opentracing
In this example we are going to create Tracer manually (mostly synchronical code). Opentelemetry documentation proposes to use Opentelemetry SDK instead (it is Promise-based), but there is an example with SDK too. Use of SDK wraps up all internal configurations, and hides some logic into global variables/context, and it requires executing / intializing tracing before main code call.
Some piece of code
Before we begin digging into configurations, there is already all together as a final code on github.
First lets import what we need later. We will explain meanings closer to the place of use.
const { TracerShim } = require('@opentelemetry/shim-opentracing')
const { AlwaysOnSampler, W3CTraceContextPropagator } = require('@opentelemetry/core')
const { NodeTracerProvider } = require('@opentelemetry/sdk-trace-node')
const { BatchSpanProcessor } = require('@opentelemetry/sdk-trace-base')
const { SemanticResourceAttributes } = require('@opentelemetry/semantic-conventions')
const { Resource } = require('@opentelemetry/resources')
const { JaegerExporter } = require('@opentelemetry/exporter-jaeger')
Sampler
Sampler is responsible for filtering Spans which should be counted and pushed forward to the consuming service (in OpenTelemtry this service ofter is called backend).
There are two built-in samplers: AlwaysOn (allow all spans, default one) and AlwaysOff (disallow all spans). In our case, we want to get all possible information, even it is very detailed. You can always have your custom Sampler, for example to remove spans/information about your external plugins.
const sampler = new AlwaysOnSampler()
Resources
Resources defines immutable attributes (properties) which are set to all spans and traces associated with the tracing service where they was used in setup.
There is a list of standard attributes where some default values are defined.
There is no requirements for setting Resources, except service_name, that helps to differenciate information services on monitoring or visualizing service (Collector).
When using SDK setup, OpenTelemetry also automatically adds some properties from process, and some properties from environment variable OTEL_RESOURCE_ATTRIBUTES
const resource = new Resource({
  [SemanticResourceAttributes.SERVICE_NAME]: `gatsby`,
  [SemanticResourceAttributes.SERVICE_VERSION]: `1.0.0`
})
Exporter
Exporter provides opportunity to export traces to the chosen service (collector, like Jaeger, Dynatrace etc)
In our example we are going to use Jaeger's one.
const exporter = new JaegerExporter({
  endpoint: `http://localhost:14268/api/traces`
})
Span processor
SpanProcessor setups how Spans will be sent to the consuming service through Exporter.
There are two basic options:
- Batching (grouping together in several big requests, default value in SDK solution)
- Simple (send one by one)
It is recommended to group spans to reduce impact on consuming service (like Jaeger server).
const spanProcessor = new BatchSpanProcessor(exporter)
Context manager and propagator
OpenTelemetry has Context mechanism that provides opportunity to store and propagate important telemetry data between traces and nested spans (for example child-parent connection). Context manager and propagator are parts of this context sharing process.
ContextManager is responsible for storing and providing access to the context value.
Propagator is using to define the method of serialize and deserialize context values, and transportation method. You can also read much more about Propagator API itself.
In our example, we will use default ContextManager (based on AsyncLocalStorage) and Propagator, that is proposed in OpenTelemetry SDK, and based on W3C trace context specification, in short words, it uses similar logic to HTTP headers that provides context - W3CTraceContextPropagator.
const contextManager = undefined
const propagator = new W3CTraceContextPropagator()
Tracer provider
TraceProvider mixes all configurations together, and provides the Tracer instance.
const tracerProvider = new NodeTracerProvider({
  sampler,
  resource
})

// Add span processor
tracerProvider.addSpanProcessor(spanProcessor)
// Turn on tracer provider
tracerProvider.register({
  contextManager,
  propagator
})
Instrumentation (optional)
Intrumentation configurates libraries to provide information in OpenTelementry format. In short, it wraps core functionalities to create traces and spans. For example, if you want to collect information about NodeJS or Express internal calls. library @opentelemetry/auto-instrumentations-node includes instrumentations for many different libraries and environments like Express, Koa, Restify, Fastify, AWS Lambda etc.
For our example, we do not need to collect information about outer environment, so instrumentation part is commented out in example code.
const { registerInstrumentations } = require('@opentelemetry/instrumentation')
const { getNodeAutoInstrumentations } = require('@opentelemetry/auto-instrumentations-node')

/*
 ... other tracing setup
 */

registerInstrumentations({
  instrumentations: [
    getNodeAutoInstrumentations(),
  ],
  tracerProvider: tracerProvider
})
Connecting to Gatsby
On the last step, we need to provide tracer from TracerProvider by OpenTracing shim to Gatsby.
exports.create = () => {
  // get tracer and pass it to Gatsby through shim
  const tracer = tracerProvider.getTracer(`gatsby-tracer`)
  return new TracerShim(tracer)
}

exports.stop = async () => {
  await tracerProvider.shutdown()
}
Final setup
Now when we have provided all tracing configurations to Gatsby we can finally send our build traces 🙌
We have two options to do that:
- in case of use
sdklibraries (because they use asynchronous setup for OpenTelementry API). See tracing-sdk.js
GATSBY_OPEN_TRACING_CONFIG_FILE=tracing-sdk.js node -r ./tracing-sdk.js node_modules/gatsby/cli.js build
- Simpler way, but it requires us to have synchronical code as in tracing.js to setup OpenTelementry API
gatsby build --open-tracing-config-file ./tracing.js
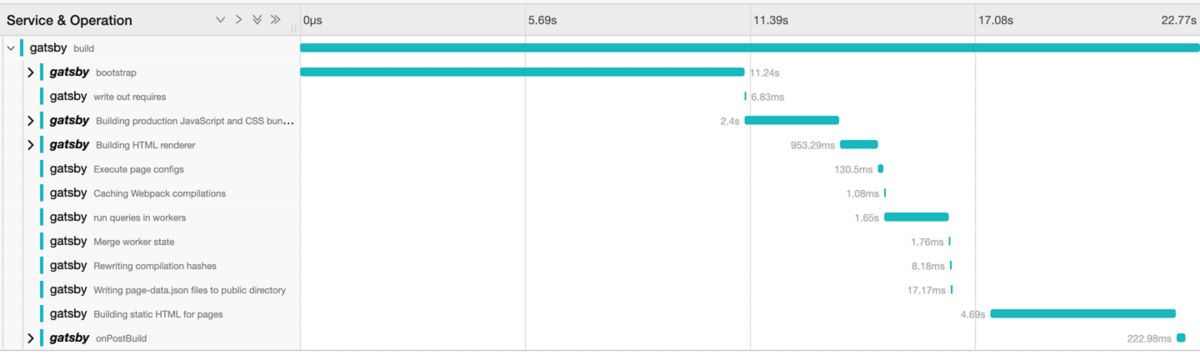
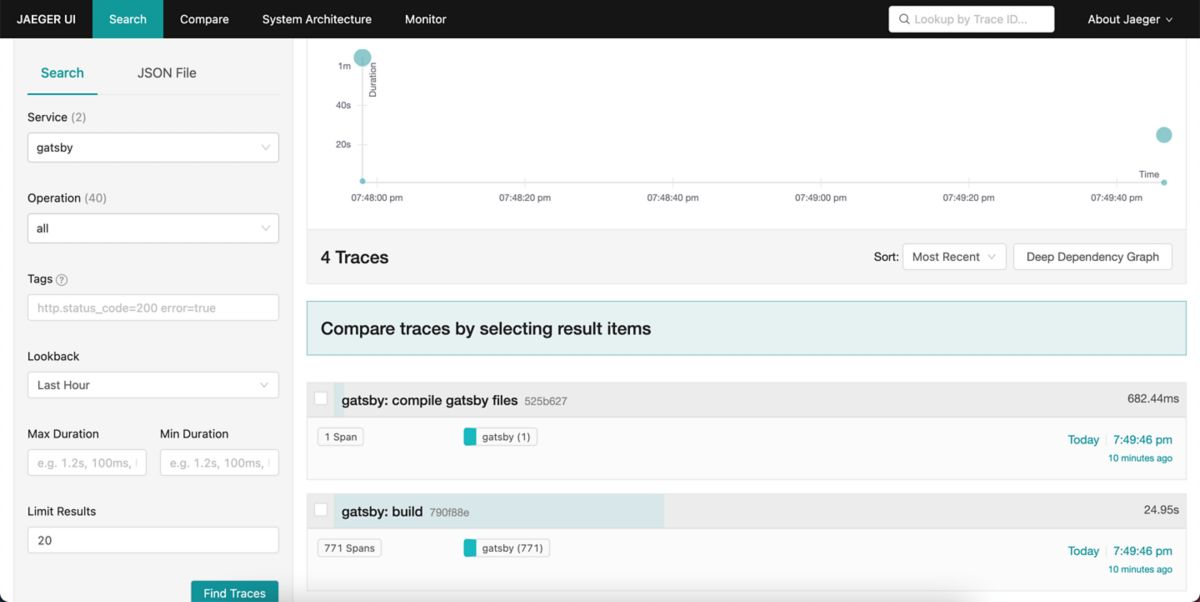
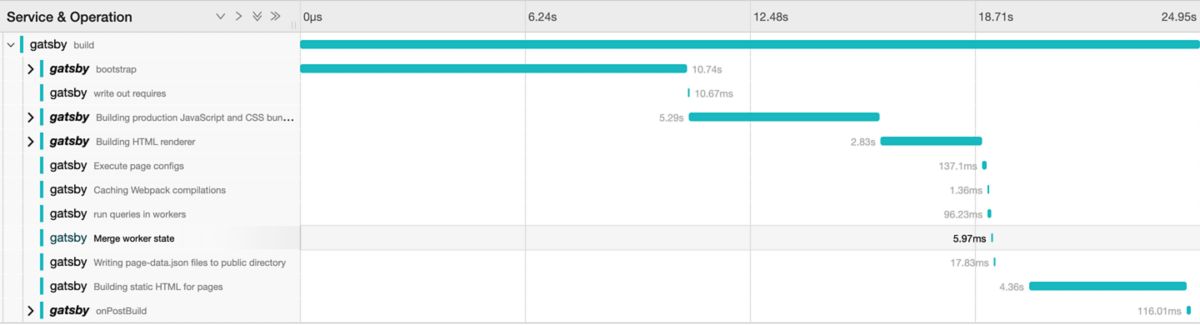
Now you should see several traces in Jaeger interface. Trace, called build, is main one and includes spans from internal Gatsby processes.
Summary
Tracing gives us real opportunity to look a little under the hood of Gatsby build process, and to have prepared data for monitoring and analysing. Unfortunately, Gatsby tracing is not suitable to debug and understand errors. You will get only some part of Spans' batches, if there is any error 🤷♂️.
Something to read more
- OpenTelemetry Sampling: Everything You Need to Know
- OpenTelemetry JavaScript Client (Github) includes most packages used in example

